K.M. Mourad, T.A. Nosseir
Automotive Department,
Faculty of Engineering,
Ain Shams University Abbasia,
Cairo, Egypt. (kmourad@netscape.net)
|
A.A. Salem
The General Nile Direct
Transport Company,
Gisr El-Suez, Cairo, Egypt.
|
Abstract:
The success in the management of a
truck fleet depends upon many factors. An important one is how good the
preventive maintenance is executed. For that reason it should be a way or a
method which can be implemented to measure or to evaluate the execution of the
preventive maintenance. The objective of this work is to use the cost of repairs
of the fleet as a base to evaluate the efficiency of the execution of the
preventive maintenance, and to find a relationship between the level of executed
preventive maintenance and the cost of repairs. In this paper, a new parameter based on cost analysis
is introduced. This new parameter, namely the maintenance grade (MG) is used as
a measure or indicator of the preformed maintenance level in different working
places. A cost study employing the MG was carried out using real data obtained
from different branches of a goods transportation company. The fleet of the
chosen company is composed of trucks of different makes and having different
operating lives. The relationship between the MG for the fleet of tucks and the
costs of the truck's maintenance and repairs was studied. Results obtained
provide insight into the execution level of preventive maintenance and its
relationship to repairs cost.
1. Introduction
Running a
big fleet of trucks efficiently, as in the case of goods transportation
companies, depends in the first place on the level of executed maintenance (EM)
applied to the trucks. The executed maintenance can be divided into two main
types. The first type is known as the scheduled maintenance and referred to as
preventive maintenance (PM), where
the second type is referred to as repairs. The preventive maintenance (PM) is a
group of different preventive activities that are performed at predetermined
intervals, based on either time, distance traveled, engine working hours, or
quantity of fuel consumed. These intervals, of course, vary with the types and
makes of trucks and their operating conditions. Basically the truck manufacturer
recommends these intervals and the schedule which should be followed. This is
denoted as the planned preventive maintenance (PPM). Examples of the PPM
activities are oils change, oils topping, greasing, filters change, checking and
adjustment of different parts and systems of the trucks.
The other
type of maintenance (i.e. the repairs) can be divided into two kinds. The first
kind is the scheduled maintenance in which truck aggregates or some of their
parts are to be replaced. Examples of such repair activities are servicing of
truck systems (braking, cooling, steering,....etc.), and the overhauling of
truck main components (engine, gearbox,....etc.). The second kind of repairs is
the unscheduled maintenance due to components failure or road accidents.
Examples of such repair activities are body, aggregates and chassis heavy
repairs.
The negligence in performing the preventive maintenance, either in its execution
efficiency or its execution rate, will lead to an increase in the repairs
activities, especially unscheduled maintenance which results from breakdowns of
truck components. The unscheduled maintenance is considered the most costly and
should be minimized, as it will never be eliminated.
The objective of this investigation is to obtain the relationship between the
level of the executed preventive maintenance (EPM) for trucks and their cost of
repairs. From this relation the efficiency of the executed preventive
maintenance can be judged. In carrying this investigation a variety of trucks of
different makes and different operating lives are considered.
2. Infield Data
A goods
transportation company had been selected to be the source of data for this
study. The chosen company had to fulfill the following requirements:
- It has a big fleet composed of different truck makes
having different operating lives.
- The fleet is distributed over several company
branches (different working places).
- The company suffered no shortage in spare parts
or labor force during the period of the study.
- The company has good and reliable records and
documentation system.
3. Approach
In order to
judge the efficiency of the executed preventive maintenance in general, there
are different parameters that could be employed. These parameters are:
- Rate of
trucks brake downs.
- Cost of
repairs.
- Rate of
working mileage.
- The
financial return from running the trucks.
All the
above parameters depend to some extent on the working conditions and the
transportation company management policy. Therefor the above parameters can not
be used accurately to compare two different working places. Hence, a new
parameter has been proposed in this study as a quantitative measuring scale,
which is to be used as a measure or an indicator for the level of performing the
executed preventive maintenance. This new parameter which is referred to as the
maintenance grade (MG) is basically based on the cost analysis and is used
throughout the study as comparative means for judging the level of EPM. The MG
is intended to be used as a measure to compare the efficiency of performing the
maintenance work in different working places; considering that the level of
labor skills and the operation conditions are the same in each working places.
The MG is
defined as the ratio of the cost of EPM to the cost of PPM. Thus it can be put
in the form:
Cost of EPM
MG = ------------------,
(1)
Cost of PPM
where the
costs of both the EPM and PPM are calculated for the same distanced covered by
the truck. The planned preventive maintenance is the maintenance schedule
recommended by the truck manufacturer. In this study both costs do not include
labor or overhead costs as well as the loss due to truck breakdown time.
4. Data Collection and Processing
To reach the
objective of this study, which is mainly to obtain the relationship between the
level of performing EPM and the cost of the spare parts used in repairs, the
infield information is essential. The type of information or data needed from
the selected transportation company is the cost of EPM, the cost of PPM and the
cost of repairs for the fleet of trucks at each company branch. The data was
collected from the documentation of the company and tabulated in specially
designed data sheets. The data sheets were designed to contain the information
of each "sample group" in each branch. The sample group is defined here as the
group of trucks, which has the same make and has the same operating life and
located in one branch. The data was collected for a "sample period"
corresponding to the fiscal year (June 1990 to May 1991). The following
information was collected in these data sheets (for each sample group in the
sample period):
- Operation
data: (the distance covered by the trucks and
their financial return).
-Preventive maintenance data: (amount of oil and grease
consumed, in addition to the kind and number of oil, fuel, and air filters).
- Repairs data: (spare parts used for maintaining the
trucks, also the spare parts used in overhauling trucks’ aggregates and in
repairing the truck road accidents, in
addition to the number of tires and batteries used.
- Unit price data: (the price of each replaced unit and
the price of the used quantity of fluids).
The repair
cost is calculated by multiplying the number of spare parts used in repairs by
the price of each part. The price of spare parts is taken from the price list at
the time of the sample period. In this study only the repairs connected to the
maintenance activities is considered. Thus, the following repair costs were
excluded from the value of repair cost:
- repair
cost due to road accidents,
- replacement of tires and batteries, also, the cost of
engines and gear boxes overhauls, since their operating lives exceed the sample
period.
The EPM cost
for each sample group in the sample period is collected from the documentation
of the company. The EPM cost is calculated by multiplying the quantities of
material and spare parts used by their prices. At the same time the costs of PPM
are calculated as shown in Appendix (A). From the resulting information of the
EPM and PPM costs, the maintenance grade MG for each sample group is calculated.
In order to make the comparison between different sample groups more obvious;
the cost rate is employed in drawing all figures. The cost rate is defined as
the cost of maintenance or repairs in the sample period divided by the total
distance traveled by the trucks of the sample group in the sample period
(L.E./1000 km). The repairs cost rate (RCR), the executed preventive maintenance
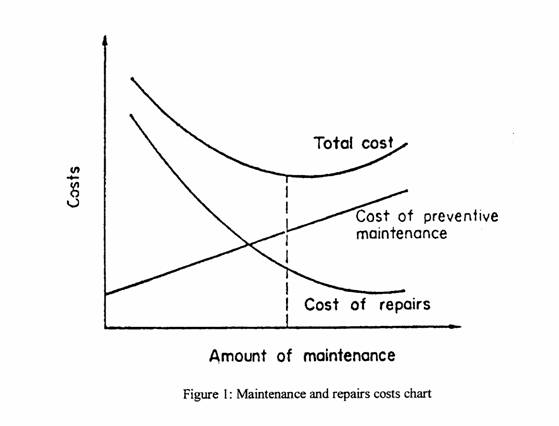
cost rate (EPMCR) as well as the total cost rate (TCR) are drawn in one chart,
named the (MG-maintenance cost rate chart). Each point in the chart represents
the cost rate of a sample group. This set of curves in the cost rate chart is
expected to be similar to the well known chart of maintenance and repairs costs
shown in Figure 1.
5. Results
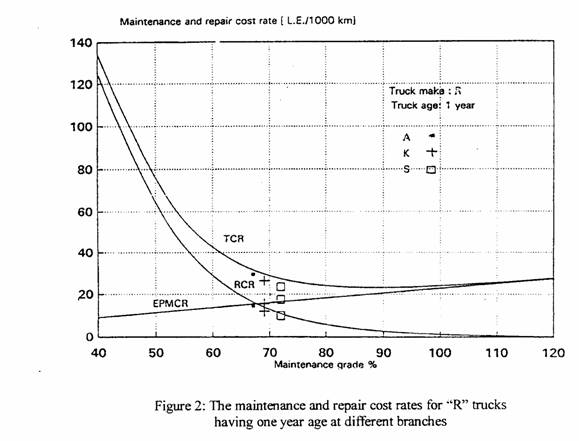
Knowing the
trend shape of the cost rate curves and using a suitable curve fitting computer
program; the curve connecting the points in the chart is drown. From Figure 2,
which represents the MG-maintenance cost rate chart, the following could be
drawn:
1-The executed preventive maintenance cost rate (EPMCR)
can be represented by a straight line in the form:
y1
= a x,
(2)
where: y1
is the cost rate of EPM (L.E./1000 km traveled), x is the MG (%), a is a
constant, representing a slope which depends on the truck make.
2-The repairs cost rate (RCR) can be represented by an
exponential curve with negative power plus a constant
in the form:
y2 = c e-b x + d,
(3)
where: y2
is the rate of RC (L.E./1000 km traveled), x is the MG (%), c, b, d are positive
real constants depending on the truck make and its operating life.
3-The total cost rate (TCR) is the summation of the
above two cost rates and its curve can be represented in the form:
y = y1 + y2,
(4)
y = ax + ce-bx + d.
(5)
4-The curve of the total cost rate has a minimum value
that can be obtained by differentiation of equation (5) and equating the result
to zero. The optimum value of MG will be equal to:
x = (1/b) ln (bc/a).
(6)
6. Discussion
As mentioned before the repairs cost due to road accidents and the cost of
overhauling of main truck components as well as the cost of the replacement of
tires and batteries have been excluded from the cost of repair. Also, the cost
of labor, tool and equipment depreciation or capital cost will not be included
in this study as they are outside the scope of the present work.
The data was
collected for different sample groups. The MG values were calculated alongside
the maintenance and repairs rates. The MG-maintenance cost rate charts are then
plotted for different sample groups. In the figures presented here each point in
the curve represents a sample group, this sample group was referred to by a
different letter and number (R6, KW10,.... etc.). Each letter represents a truck
make, while the number denotes its operating life (age). From the figures it can
be seen that increasing the MG value, which in turn means increasing the rate of
EPM cost, will lead to a decrease in the rate of repairs cost. From the figures
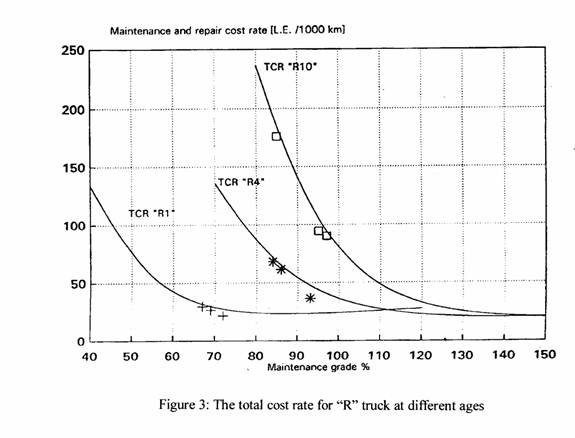
the repairs cost rate is different for trucks having the same make but having
different operating lives. Figure 3 shows the MG-maintenance cost rate chart for
different truck ages. From this figure it can be seen that as the truck age
increases the corresponding slope (MG) increases. From these slopes one can
conclude that, the greater the operating life of the truck the more sensitive
the truck is to the change in MG value. The increase in the repair cost rate for
old trucks can be seen clearly. The old truck curve is shifted upwards and to
the right. The shift to the right can be due to the EPM operation not being
carried out as scheduled for new trucks, but is carried out most of the time
when the truck is stopped for the repairs (unscheduled maintenance). The other
reason for the increase in the EPM cost for old trucks is also due to the cost
of oil topping up the engines and gearboxes (bad gaskets and oil seals). The
small values of MG for new trucks are contributed to the poor maintenance
operation (long time intervals between executing the PM).
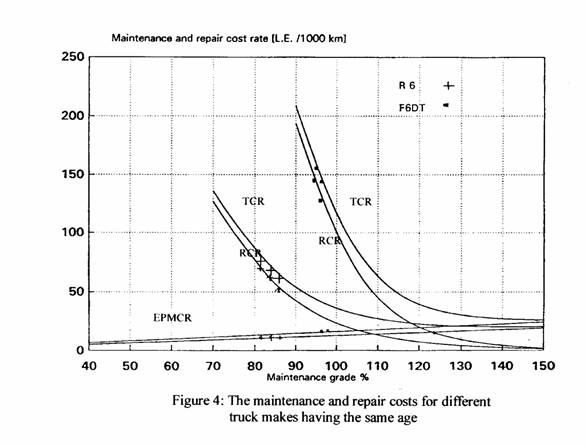
To find out
the effect of truck makes on the repair cost, two sets of data were used to draw
Figures 4. Presented in Figure 4 is the MG-maintenance cost rate for two truck
groups having the same operating life. From these curves one can see that in
general, increasing the maintenance level decreases the repairs cost. The slopes
of the maintenance curves are a little different due to the difference in the
volume of oil used and the number and cost of filters involved in the
maintenance operation. Though the maintenance cost rate is nearly the same for
the two makes, there is a big difference in the repair cost rate. This
difference is mainly due to the difference in the price of the spare parts.
When the
MG-maintenance cost rate charts were examined thoroughly two cases were observed
in some of the sample group data, which are considered here as abnormal ones and
deserved close study. In the first case although the EPM cost is greater than
the PPM cost, which lead to an increase in the MG value, no decrease is observed
in the repair cost. This indicates that there was overdoing of the maintenance
operation, yet it had little or no effect on maintaining the trucks. After
infield investigation it was found that, the obvious reason was due to abnormal
increase in the cost of the oil used. The increase in oil consumption is
attributed to the following causes:
-the change of engine oil does not follow the
manufacturer recommendation but takes place at shorter intervals,
- a great amount of oil is used during the period of
running-in the engines and gearboxes after conducting the overhauling,
- bad
gaskets and oil seals lead to repeatedly topping-up
of the engine oil in the period between two
successive engine oil changes,
- the bad habit of the garage technicians of topping up
the engine oil over the level indicated by the engine dip stick.
In the
second case, the EPM cost is found to be much less than the PPM cost (unusual
low value of MG) and is accompanied by high repair cost. That is thought to be
due to abnormal circumstances in maintenance operations practice. This case is
investigated closely and the results can be summarized as follows:
- shortage occurred in some of the high priced filters,
due to bad company administration policy.
- the maintenance operation is not performed correctly
(as in the case of greasing which lead to abnormal replacement of universal
joints and intermediate supports of the propeller shafts).
7. Conclusions
Several results from the analysis of the data were obtained. Several conclusions
can be drawn based upon these results. The main conclusions that were drawn from
the obtained results are as follows:
1- Evaluation of different truck makes and the level of
performing their preventive maintenance can be done based on the cost-analysis.
2- The defined parameter, MG, can be used successfully as a
measure of the level of maintenance executed in the different working places.
3- The MG-maintenance cost rate chart could be used to
evaluate the effectiveness of executing the PPM operations in the
different branches of the transportation companies.
At the same time, it could be used to show the effect of the operating life of
each truck make on the total cost rate at a later stage, when making the
decision of buying new trucks.
4- Increasing the maintenance level MG leads to a decrease in
the repair cost rate. There is an optimum
MG value which corresponds to the
minimum total cost rate. These optimum values depend on truck make and age and
also depend on maintenance and working conditions.
5- The old trucks (with higher operating lives) are very
sensitive to negligence of performing the preventive maintenance than the new
ones.
6- The MG-maintenance cost rate can be used to reschedule and
modify the PPM with respect to:
-the truck operational life; so the executive interval of
PPM should be shortened as the truck operational life increases.
-the truck make; taking into consideration the working and execution maintenance
conditions.
8. References
1-Salem, A., Feasibility Study of Preventive
Maintenance Implementation",
M.Sc. Thesis, Ain Shams University, Cairo, Egypt, 1992.
9. Acknowledgment
The authors
of this paper wish to express their gratitude to the personnel of the General
Nile Direct Transport Company for helping in providing the necessary data and
documentation.
APPENDIX (A)
Calculation of the PPM Cost
The PPM is scheduled according
to the manufacturer’s recommendation, to be carried out every certain distance
traveled by the truck. The PPM consists of three main types of maintenance,
namely maintenance A, B and C, which are carried out every 5,000, 10,000 and
40,000 km respectively. For each type of maintenance, A, B, and C there are
several different operations which are to be carried out.
To calculate the cost of the PPM for each sample group in the sample period,
some steps were followed. First, the total distance traveled (TDT) by the trucks
in each sample group were collected from the company documentation. Second, the
number of each type of scheduled maintenance were calculated according to the
following:
Number of
maintenance C (NC)
TDT
NC = ---------,
(7)
40,000
Number of
maintenance B (NB)
TDT
NB = -------- - NC,
(8)
10,000
Number of
maintenance A (NA)
TDT
NA = --------- -
(NC + NE). (9)
5,000
The cost of
each operation executed in each maintenance type was obtained from the price
list during the sample period. The cost of all operations in each type of
maintenance was summed up for each sample group. Finally, the total PPM cost was
obtained by multiplying the cost of each maintenance type by its number, then
added them together.
APPENDIX (B)
List of Symbols
EM acronym
for executed maintenance.
EPM acronym for executed preventive maintenance.
EPMCR acronym for executed preventive maintenance
cost rate
MG acronym for maintenance grade.
NA acronym for number of maintenance
type A.
NC
acronym for number of maintenance type C.
NE acronym for number of maintenance
type B.
PM acronym for preventive maintenance.
PPM acronym for planned preventive maintenance.
RC acronym for repair cost.
RCR acronym for repairs cost rate
TCR acronym for total cost rate (RCR+EPMR)
TDT acronym for total distance traveled
by the trucks
in the sample group during the sample period.